
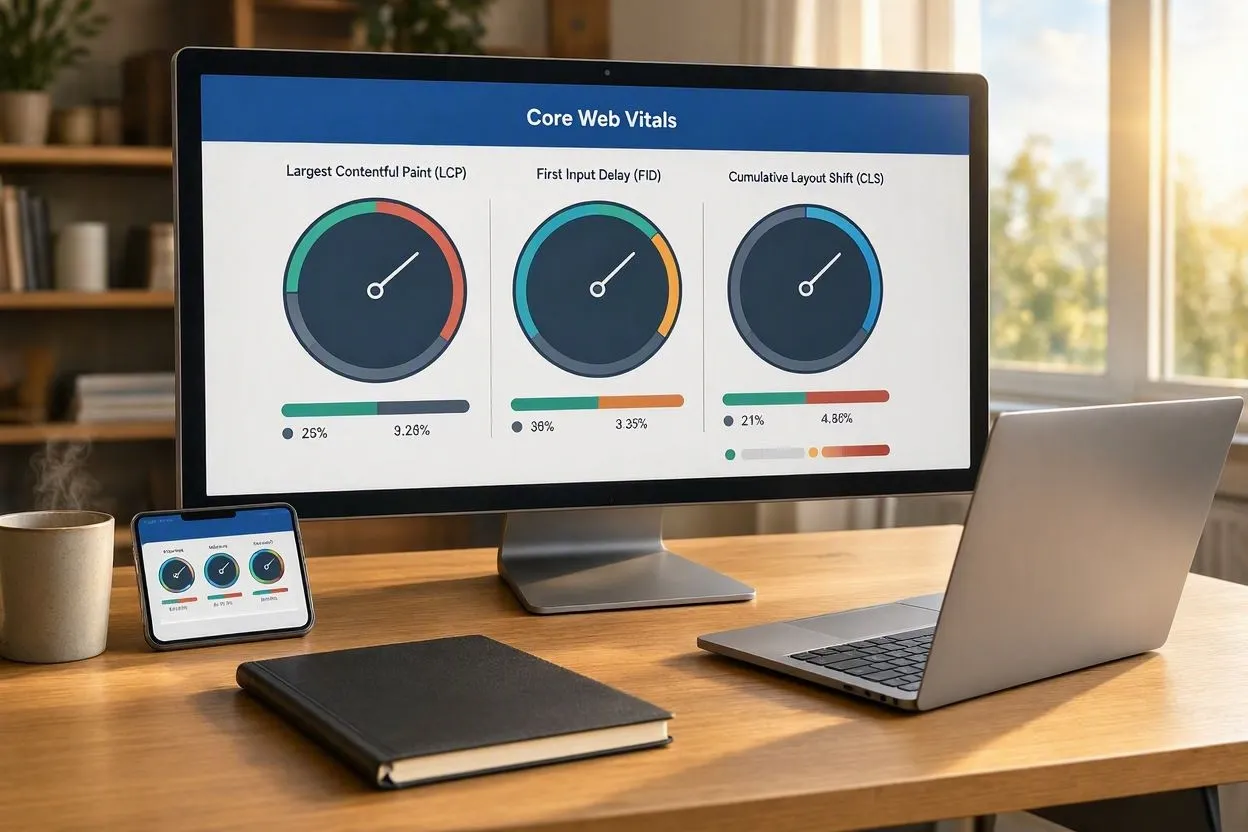
Core Web Vitals is a set of three Google metrics that measure real-world page experience: Largest Contentful Paint (loading speed), Interaction to Next Paint (responsiveness), and Cumulative Layout Shift (visual stability). A page passes when all three hit their “good” threshold at the 75th percentile of real Chrome visits, not a lab test. That rule explains why a page can score 98 in Lighthouse and still fail in Search Console the same week: one number comes from a simulated desktop on a fast connection, the other from thousands of real sessions, a quarter of them on mid-range Android phones with spotty signal.
Accuracy is the second problem. Plenty of well-ranked articles still list First Input Delay as one of the three metrics, but Google retired First Input Delay on March 12, 2024. This guide covers the three current metrics, their thresholds, how Google actually calculates a pass, and how long a fix takes to show up in your reporting.
What Is Core Web Vitals?
They sit inside a wider set of performance signals called Web Vitals. Core Web Vitals are just the three Google singled out for search, which matters because supporting metrics like Time to First Byte (TTFB) and Total Blocking Time (TBT) help you diagnose problems without ever being scored themselves.
The scoring runs on field data. Chrome collects anonymized timings from real visits and rolls them into the Chrome User Experience Report (CrUX), the dataset behind both PageSpeed Insights and the Core Web Vitals report in Search Console. A page needs enough Chrome traffic to qualify for its own CrUX data; low-traffic URLs fall back to origin-level data covering the whole site.
The Three Metrics and Their Thresholds
A page passes Core Web Vitals when all three metrics land in the “good” band: LCP at 2.5 seconds or less, INP at 200 milliseconds or less, CLS at 0.1 or less. Miss one and the page fails, no matter how strong the other two look.
| Metric | Measures | Good | Needs improvement | Poor |
| Largest Contentful Paint (LCP) | Loading | ≤ 2.5s (2,500 ms) | 2.5–4.0s | > 4.0s |
| Interaction to Next Paint (INP) | Responsiveness | ≤ 200ms (0.2s) | 200–500ms | > 500ms |
| Cumulative Layout Shift (CLS) | Visual stability | ≤ 0.1 | 0.1–0.25 | > 0.25 |
Largest Contentful Paint (LCP): Loading
LCP measures how long the largest visible image or text block takes to render inside the viewport. Only the visible area counts, so a huge image sitting below the fold never becomes the LCP element, no matter how large it is.
The element is usually predictable. On a product page it’s the main photo; on an article it’s the hero image or the H1. Run any URL through PageSpeed Insights and the report will name the exact LCP element for you, so you’re not guessing before you touch any code.
A 2.5-second target sounds generous until you factor in a mid-range Android phone on 4G. Same page, same server, roughly double the render time.
Interaction to Next Paint (INP): Responsiveness
INP measures how quickly a page visibly responds after a user clicks, taps, or presses a key, across the entire visit, not just the first interaction. It reports the slowest interaction of the session, so one laggy accordion toggle can drag down the score for a page that otherwise felt fine.
Heavy JavaScript causes most INP failures. Picture a page running a tag manager, a chat widget, a consent banner, and a carousel library all at once. Each one competes for the same browser main thread, and a click that lands mid-task has to wait for that task to finish before anything repaints.
Cumulative Layout Shift (CLS): Visual Stability
CLS measures how much content moves unexpectedly while a page loads, scored by the worst burst of shifts rather than the total across the whole session. Google calculates each shift as an impact fraction multiplied by a distance fraction.
Here’s what that looks like in practice. A 728×90 ad slot loads without reserved space on a 400-pixel-tall viewport and pushes 200 pixels of content down by 50 pixels. Impact fraction: 200 divided by 400, or 0.50. Distance fraction: 50 divided by 400, or 0.125. Multiply the two and you get a layout shift score of 0.0625, still inside the good band. A second unsized element on that same page, though, and you’re over 0.1 fast.
Why First Input Delay No Longer Counts
FID stopped being a Core Web Vitals metric on March 12, 2024, when Interaction to Next Paint took its place. Any guide still listing FID as one of the three metrics is describing a version of Core Web Vitals Google retired more than two years ago.
The replacement fixed a real blind spot. FID only timed the delay before the browser began processing the first interaction on a page, which meant a site could score well while every interaction after that first one lagged badly. INP tracks all interactions and reports the slowest, which is a far more honest picture of responsiveness.
Metric changes shouldn’t come as a shock. Google launched Core Web Vitals in 2020 with LCP, FID, and CLS, then swapped one metric out four years later. LCP and CLS have kept the same thresholds since launch, and INP’s 200-millisecond target has held since March 2024.
How Google Decides Whether a Page Passes
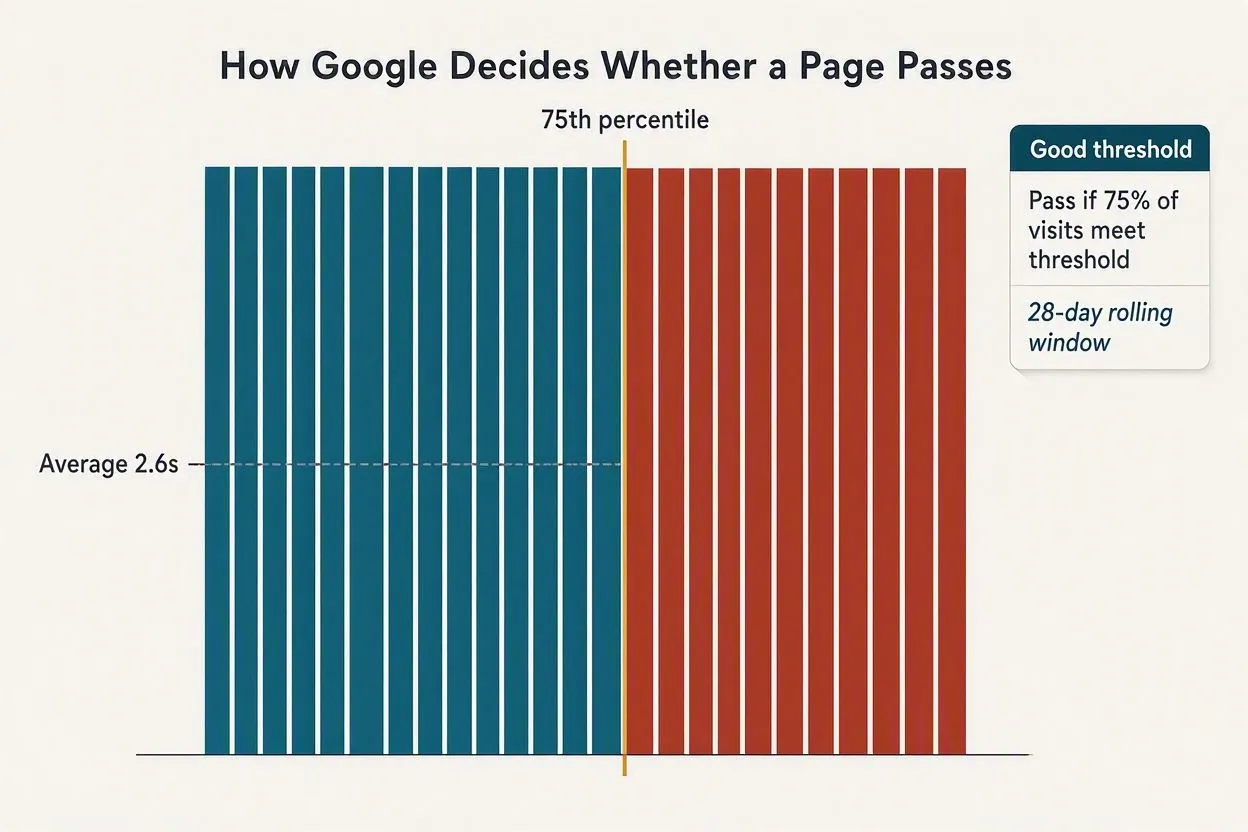
Google checks each metric at the 75th percentile of real sessions collected over a rolling 28-day window. Your page passes a metric only if at least 75% of those visits hit the good threshold.
Averages hide the visits that fail. Say you have 100 sessions where 80 return an LCP of 1.8 seconds and 20 return 6 seconds. The average lands at 2.6 seconds, which looks fine, but Google isn’t reading the average. It’s reading the 75th percentile, and the slowest quarter of that distribution is what decides the outcome. Fast visits don’t rescue a page that’s getting dragged down by underpowered devices and congested networks.
Two more rules govern the assessment. All three metrics have to pass together, so one metric sitting in the needs-improvement band fails the whole page. And mobile and desktop get scored separately, meaning a page can pass on desktop and fail on mobile. Given mobile-first indexing, the mobile result is the one that carries weight.
Skipping the 75th percentile rule is probably the single most common mistake in Core Web Vitals reporting. It turns every lab score into a false positive.
Field Data vs Lab Data: Why Two Tools Disagree
Field data records what real visitors experienced. Lab data records what one simulated device experienced under controlled conditions. Google ranks on field data, full stop.
| Field data | Lab data | |
| Source | Chrome User Experience Report (CrUX) | Lighthouse, WebPageTest |
| Devices | Real visitors, all hardware and networks | One simulated device and connection |
| Used for ranking | Yes | No |
| Best for | Confirming whether a page passes | Debugging before deployment |
| Available immediately | No, needs traffic volume | Yes, on demand |
Lighthouse won’t produce an INP score at all, because INP requires real interactions that a synthetic page load never performs. Tools substitute Total Blocking Time instead, and that substitution is where a lot of reporting goes sideways: TBT is a lab proxy, not INP. A page can post a poor TBT and pass INP comfortably, or post a clean TBT and still fail INP because one rarely-used button runs an expensive handler.
Use Lighthouse to find causes. Use CrUX to confirm results.
How to Check Core Web Vitals on Your Site
Four tools cover the full workflow, and each answers a different question.
Google Search Console groups URLs by shared problems and shows site-wide pass rates pulled from CrUX. Start here to find which template is failing.
PageSpeed Insights combines CrUX field data with a live Lighthouse run for one URL, and it names the specific LCP element. Use it to dig into a single page.
The CrUX Dashboard in Looker Studio plots your metrics month over month, which is how you line up a drop in performance with a deployment date.
Google’s own web-vitals JavaScript library collects LCP, INP, and CLS from your actual visitors in real time, including pages CrUX doesn’t cover at all.
That last one solves a problem the others can’t touch. CrUX excludes URLs without enough Chrome traffic, so a brand-new product page or a low-volume category page just shows up blank. Installing web-vitals gives you first-party monitoring on every page from day one, and it costs you about 2 KB gzipped.
What Breaks Each Metric, and How to Fix It
Each metric breaks down into sub-parts, and fixing the right one matters more than generic speed advice ever will. “Optimize your images” won’t help a page whose real LCP problem is a 900-millisecond server response.
Fixing LCP by Its Four Sub-Parts
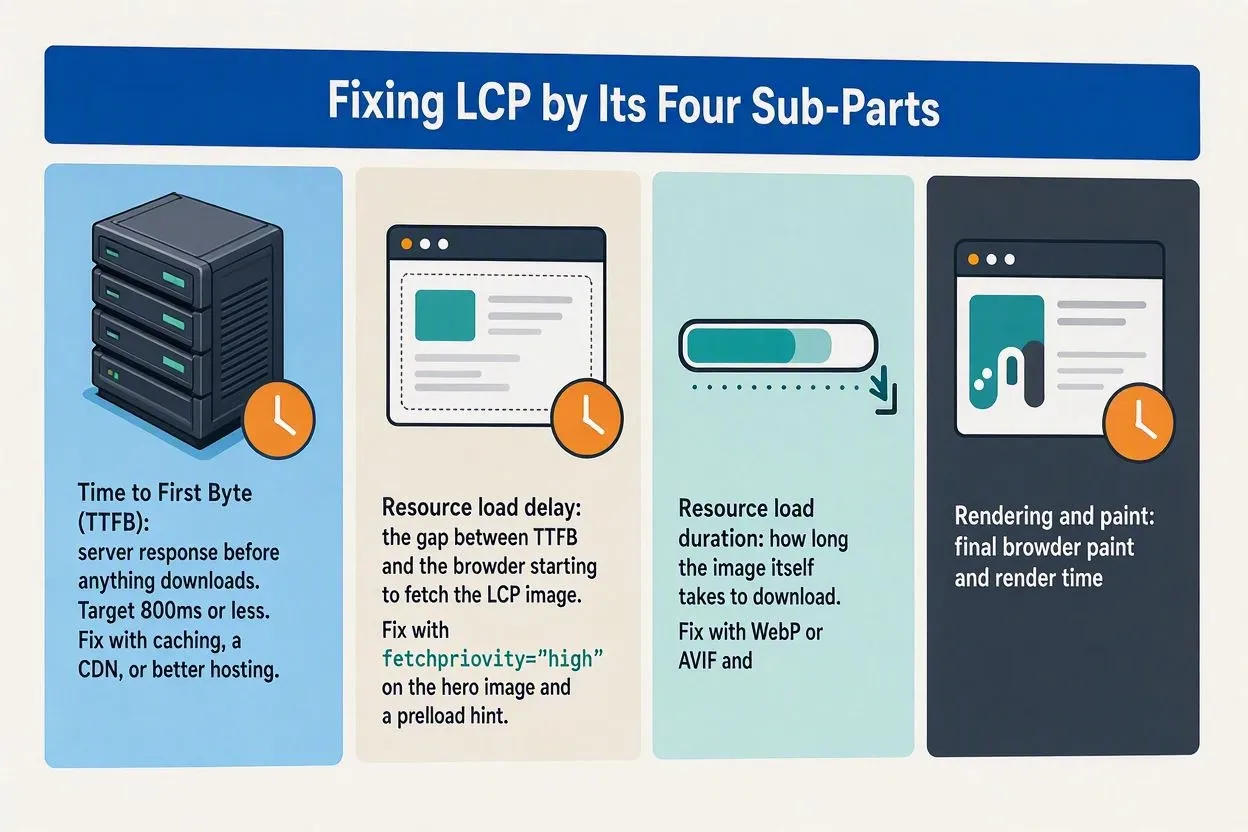
LCP splits into four phases you can measure separately:
- Time to First Byte (TTFB): server response before anything downloads. Target 800ms or less. Fix with caching, a CDN, or better hosting.
- Resource load delay: the gap between TTFB and the browser starting to fetch the LCP image. Fix with fetchpriority=”high” on the hero image and a preload hint.
- Resource load duration: how long the image itself takes to download. Fix with WebP or AVIF and properly sized responsive images.
- Element render delay: the gap between the download finishing and the pixel actually appearing. Fix by removing render-blocking CSS and deferring non-critical JavaScript.
Diagnose before you guess. A page where TTFB eats 1.4 seconds of a 3.1-second LCP isn’t going to improve much from image compression, no matter how aggressive you get with it.
Fixing INP by Its Three Sub-Parts
INP splits into three phases:
- Input delay: the browser’s busy with another task when the user clicks. Fix by breaking long tasks into chunks under 50ms and deferring third-party scripts.
- Processing duration: your event handler is running. Move heavy computation into a web worker and trim what runs synchronously on click.
- Presentation delay: the browser paints the result. Reduce DOM size and avoid layout thrashing inside handlers.
Third-party scripts dominate real-world INP failures. Chat widgets, A/B testing tools, consent managers, they all register handlers on the main thread, and pulling one unused tag often does more good than a week spent refactoring your own code.
Fixing CLS Inside the Session Window
CLS counts shifts inside a session window that can run up to 5 seconds, closing after a 1-second gap with no movement. Your score is the worst window, not the total across the whole page.
Four fixes cover most CLS failures. Set width and height on every image and video so the browser reserves space before the file even arrives. Reserve fixed space for ads, embeds, and iframes with a container that has a set minimum height. Load fonts with font-display: optional or preload them, so you don’t get the reflow that comes from a late-swapping web font. And keep dynamic content like cookie banners and promo bars from injecting above existing content.
Which Metric to Fix First
Fix TTFB first, then work outward to LCP, INP, and CLS in that order. Server response time feeds directly into LCP, so improvements there carry over automatically instead of needing separate work.
After that, it depends on your site. Content sites, publishers, blogs, and documentation should prioritize LCP, since readers judge those pages by how fast the text shows up. Interactive sites like e-commerce checkouts, dashboards, and booking flows should prioritize INP instead. A laggy click there costs you an abandoned cart, not a mild annoyance.
If it’s still a toss-up, go with whichever is easier to ship. Adding width and height attributes to your images takes an afternoon. Restructuring a JavaScript bundle takes a sprint.
Do Core Web Vitals Affect Rankings?
Yes. Core Web Vitals feed into Google’s page experience signals, which Google says align with what its core ranking systems reward. Google has never published exactly how much weight the three metrics carry relative to other signals, so treating any specific percentage as fact would be misrepresenting what’s actually been disclosed.
Relevance still wins overall. A page that answers the query better will outrank a faster page that answers it worse, and no amount of performance work makes up for content that misses the intent. Core Web Vitals function more as a tiebreaker between pages of similar relevance, and as a floor below which user behavior itself starts working against you.
The business case is easier to measure than the ranking case. In Google’s own research with SOASTA, the probability of a visitor bouncing rose 32% as load time went from 1 to 3 seconds, and 106% at 6 seconds. Those numbers hold whether or not you ever see a ranking effect show up in your reports.
Why Your Score Doesn’t Move After You Deploy a Fix
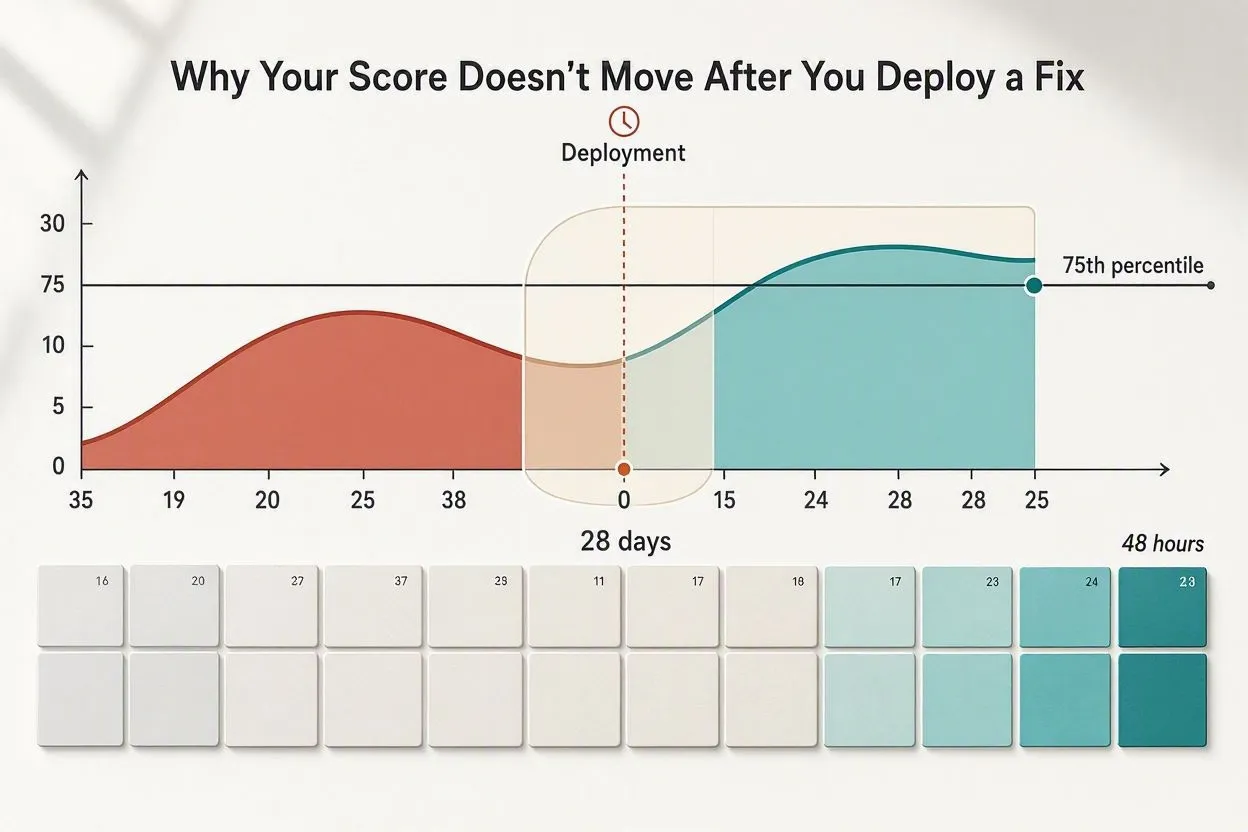
Per Google’s own CrUX documentation, the dataset itself is refreshed roughly every two days, even though it reports on a rolling 28-day window. New data starts entering that window within about 48 hours of deployment.
Every day, CrUX drops the oldest day of sessions and adds a new one, so a page needs a full 28 days before post-fix data has completely replaced pre-fix data. How fast the 75th percentile actually crosses into the good band depends on how far below the threshold you started: a page sitting at 2.7 seconds flips within days, while a page at 5 seconds can take weeks.
Two things follow from that. Search Console will lag your deployment by two to four weeks before it shows a clean trend, and first-party monitoring through the web-vitals library gives you the same signal within hours. If your team ships performance work weekly, you need that second option, because Search Console alone can’t tell you whether last Tuesday’s change actually helped.
Conclusion
Core Web Vitals reward pages that load fast, respond immediately, and hold still, measured on the devices your visitors actually own, not the machine you built the site on.
Install the web-vitals library before you ship the first change. Field data from your own visitors shows up within hours, and it’s the only real way to know whether Tuesday’s deployment moved the 75th percentile in the right direction.