
Google Ads wins when someone is already searching for what you sell, and Facebook Ads (now run through Meta Ads Manager) wins when you need to put that offer in front of people who aren’t searching yet. Google Ads catches demand that already exists. Meta builds demand that doesn’t. Most businesses need both eventually, but the order you turn them on, and the budget you give each one, depends on a handful of factors most comparison guides skip entirely.
That’s the actual question behind “Google Ads vs Facebook Ads.” Not which platform is objectively better, but which one matches where your buyer already stands.
What Actually Separates Google Ads From Meta Ads
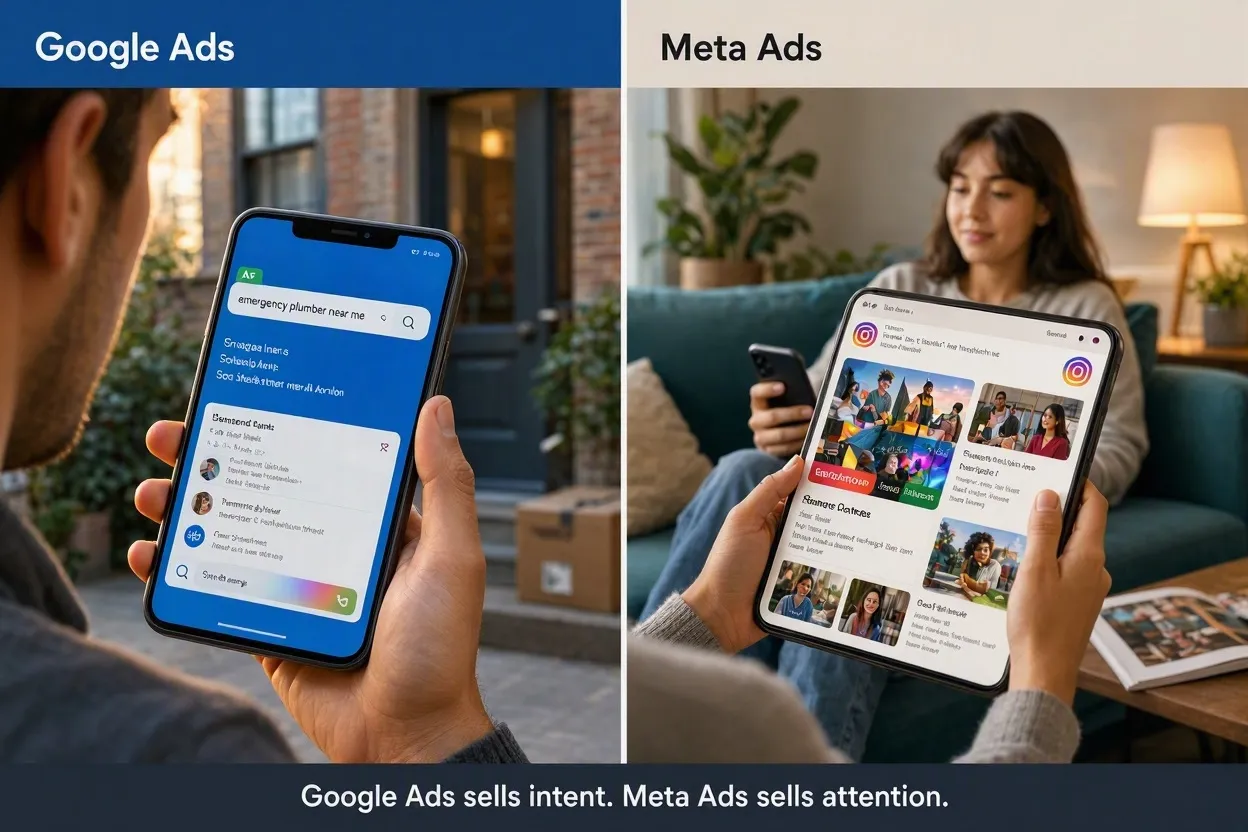
Google Ads sells intent. Meta Ads sells attention. Someone typing “emergency plumber near me” has already decided to act; Google Ads shows up at that exact moment. Someone scrolling Instagram between messages hasn’t decided anything yet. Meta’s job is to interrupt that scroll with something worth stopping for.
A quick naming note, because it trips people up constantly: “Facebook Ads” as a standalone product doesn’t really exist anymore. It’s Meta Ads Manager now, and a single campaign can run across Facebook, Instagram, Messenger, and Threads at once. The keyword people type hasn’t caught up to the product, but the platform has moved on.
This intent gap explains almost everything else in this comparison. It’s why Google traffic converts faster but costs more per click. It’s why Meta needs stronger creative but reaches people three funnels earlier. And it’s why comparing them on cost alone, without accounting for where each shopper actually is, tells you almost nothing useful.
Google Ads vs Facebook Ads at a Glance
| Factor | Google Ads | Facebook (Meta) Ads |
| What it sells | Existing search demand | New audience attention |
| Cost model | Higher CPC, faster conversion | Lower CPC, longer nurture |
| Targeting basis | Keywords and search intent | Interests, behavior, lookalikes |
| Best ad surfaces | Search, Shopping, YouTube, Display | Feed, Stories, Reels, Messenger |
| Funnel stage | Middle to bottom | Top to middle |
| Minimum realistic monthly budget | $1,000-$1,500 for most local verticals | $1,500-$2,000, driven by the learning phase, not the bid |
Cost Benchmarks: CPC, CPA, and Minimum Budget
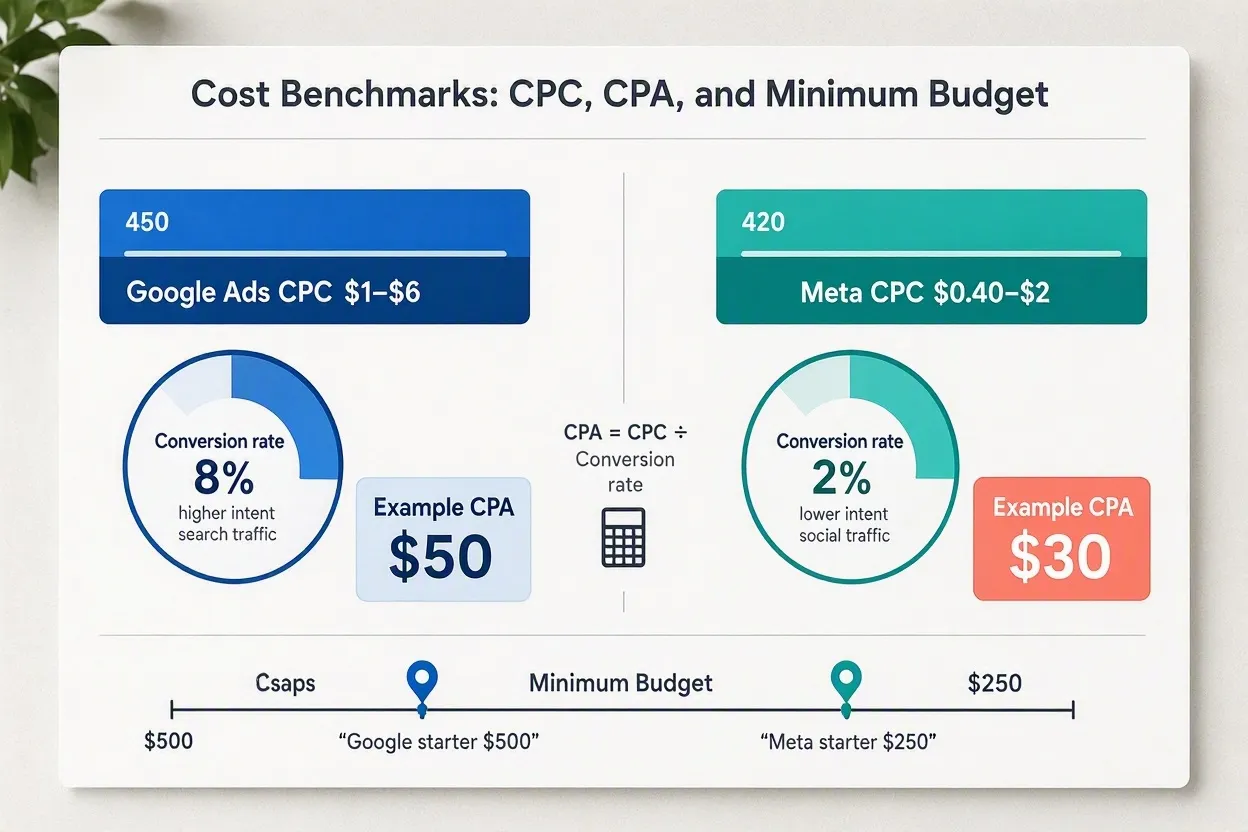
Google Ads search campaigns typically run $1 to $6 per click for most small business categories, while Meta campaigns often land between $0.40 and $2. That gap looks like Meta’s the obvious winner until you factor in conversion rate. Search traffic on Google converts at a higher rate because the person already wants what you’re selling. A $4 click that converts at 8% can beat a $0.60 click that converts at 2%, once you run the actual cost per acquisition (CPA) instead of comparing sticker price.
Meta has a mechanical floor that most comparisons never mention: the learning phase. Each ad set needs roughly 50 optimization events, typically conversions, within a seven-day window for Meta’s delivery algorithm to exit learning and stabilize. If a $500 monthly budget can’t produce 50 conversions in a week at your average order value, the campaign never really leaves the learning phase. It just burns money in a permanently unoptimized state. This is the single most common reason small Meta budgets underperform, and none of the major comparison articles quantify it.
Google Ads doesn’t have an equivalent hard floor, though thin budgets still limit impression share and force the algorithm into a narrower bidding window than it needs.
A Scored Decision Framework
Score each factor from 1 (low) to 5 (high) for your specific offer.
- Search intent existence. Do people already type something close to your product into Google? A 5 means yes, constantly. A 1 means the category barely exists as a search term yet.
- Audience definability. Can you describe your buyer by interest, behavior, or lookalike traits well enough for Meta to target them? Specific hobbies and life events score high; vague B2B titles score low.
- Creative production capacity. Meta’s delivery rewards fresh creative volume. If your team can produce four to six new ad variations monthly, score a 4 or 5. If you have one static image and no plan to update it, score a 1.
- Budget floor. Can you commit at least $1,500 monthly to whichever platform you pick, for at least 60 days, without pulling the plug early?
- Sales cycle length. Short cycles (same-week purchase decisions) favor Google’s bottom-funnel intent capture. Long cycles (weeks or months of consideration) leave more room for Meta’s nurture-heavy approach to pay off.
Add the five scores. A total above 20 with intent existence and creative capacity both scoring 4 or higher points toward running both platforms concurrently. A total in the low teens, with creative capacity under 3, points toward Google Ads first and Meta once a creative pipeline actually exists.
Performance Max vs Advantage+: The Comparison Nobody Runs
Every competing article name-drops Performance Max (PMax) and Advantage+ in passing. None of them actually compares the two, which is strange, because in 2026 this is the real head-to-head, not the legacy “Search vs Feed” framing.
PMax and Advantage+ both hand targeting, bidding, and creative combination decisions to automation, pulling from a single asset pool across every placement the platform owns. PMax spans Search, Display, YouTube, Gmail, Maps, and Shopping from one campaign. Advantage+ does the same across Feed, Stories, Reels, and Messenger. The advertiser’s job shrinks to feeding the system quality inputs: product feeds, creative assets, and conversion signals, rather than picking individual placements or bids.
Where manual control still earns its keep: negative keywords and search theme exclusions in PMax, and detailed audience exclusions in Advantage+, both still block the account from wasting spend on clearly wrong traffic that automation alone won’t catch. Neither platform’s automated layer replaces a human checking search terms and audience overlap on a weekly basis.
Google’s other 2026 answer to Meta is Demand Gen, a visually driven campaign type running across YouTube, Discover, and Gmail that behaves much closer to a feed-scroll experience than to traditional search. It’s Google’s clearest acknowledgment that some demand needs to be created, not just captured, and none of the five ranking articles on this topic mention it at all.
Why Google and Meta Disagree on Who Gets Credit
Run the same campaign period on both platforms and pull each one’s reported conversions. They won’t match, and the mismatch isn’t a tracking bug. It’s a structural difference in attribution windows.
Meta’s default attribution window credits a conversion up to seven days after a click or one day after a view, while Google’s data-driven attribution model distributes credit across the entire path a shopper took before converting. A shopper who saw a Meta ad on Monday, searched the brand name on Google on Wednesday, then bought on Thursday will show up as a Google conversion in Google’s dashboard and a Meta conversion in Meta’s, because each platform only sees its own half of the journey.
Two ways practitioners actually settle this instead of arguing over dashboard numbers:
Geo holdout tests split matched markets into an ad-on group and an ad-off group, then measure the real lift in one against the other, independent of either platform’s self-reported attribution. Meta’s own Conversion Lift tool and Google’s draft and experiments feature both run a version of this natively.
Marketing efficiency ratio (MER), total revenue divided by total ad spend across every channel combined, sidesteps the attribution argument entirely by refusing to assign credit platform by platform. Blended customer acquisition cost (CAC) does the same job from the cost side. Neither metric cares which dashboard claims the conversion.
Policy Constraints That Override the Framework
Before any scoring system matters, check whether the industry itself restricts what either platform allows.
Meta’s Special Ad Categories, covering housing, employment, and credit, strip out age, gender, ZIP code, and most detailed targeting options entirely, regardless of budget or creative quality. A mortgage broker or an apartment complex running Meta ads under these restrictions gets a fraction of the targeting precision a retail brand takes for granted. This single policy shift can flip the framework’s recommendation for an entire vertical, and it’s absent from every one of the five ranking articles on this topic.
Healthcare and financial services face parallel restrictions on both platforms, often blocking retargeting based on browsing behavior tied to sensitive categories. Before assuming Meta’s granular targeting advantage applies to a given account, confirm the industry isn’t one where that advantage has already been legislated or policy-restricted away.
Which Platform Wins, by Business Type
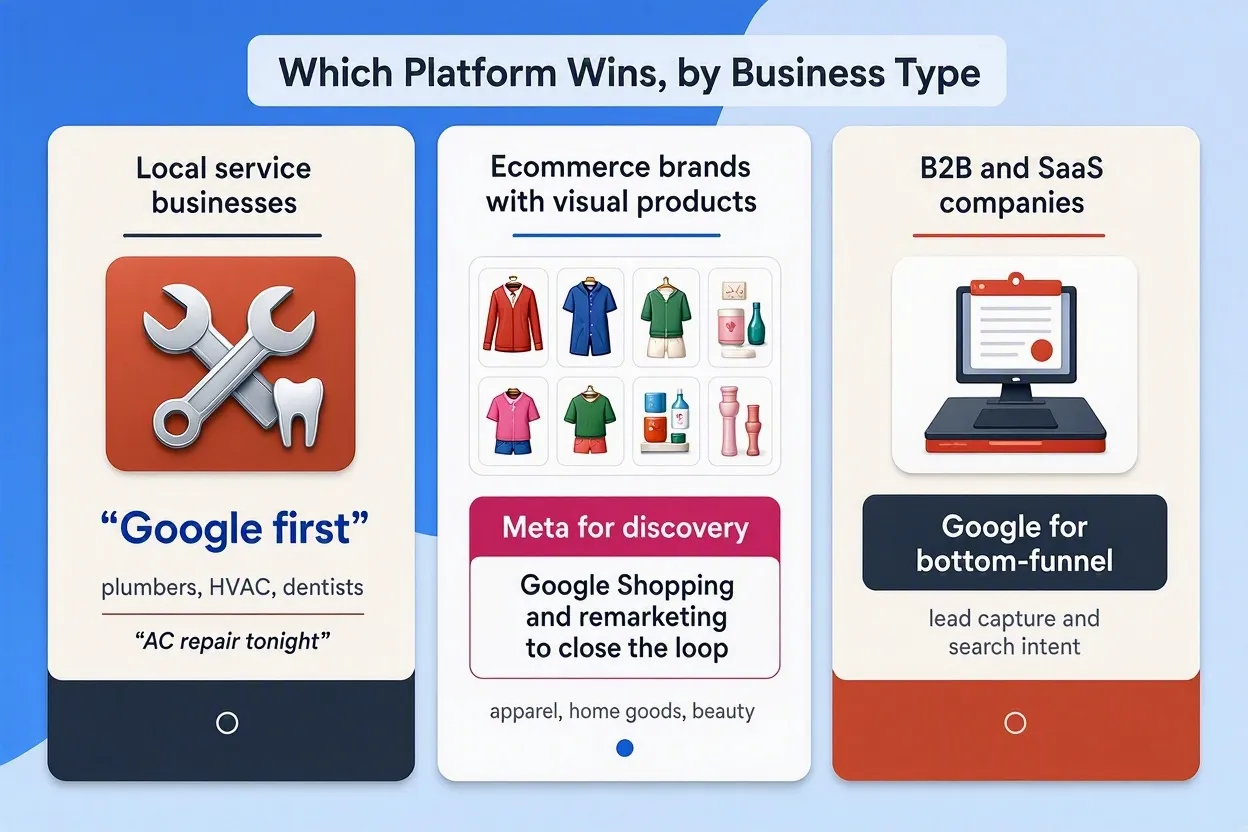
Local service businesses (plumbers, HVAC, dentists) lean Google first. Someone searching “AC repair tonight” is closer to a phone call than any feed ad will get them.
Ecommerce brands with visual products (apparel, home goods, beauty) often see Meta outperform on discovery, then rely on Google Shopping and remarketing to close the loop once someone’s already aware of the brand.
B2B and SaaS companies typically need Google for bottom-funnel keyword capture (a competitor comparison search, a specific tool name) paired with LinkedIn or Meta for top-of-funnel awareness, since Google search volume for niche B2B categories is often too thin to carry a budget alone.
Healthcare providers, subject to the policy constraints above, frequently find Google’s intent-based targeting more resilient than Meta’s restricted audience options.
High-ticket or considered purchases (real estate, financial planning, enterprise software) usually need both: Meta for the long nurture sequence, Google for the moment someone finally searches the brand name to convert.
Time to Signal and Kill Criteria
Google Ads campaigns generally show a directional read within 7 days if daily click volume supports at least 15-20 clicks; by day 30, cost-per-conversion trends should be stable enough to act on.
Meta campaigns need the full learning phase (roughly 7 days, assuming the 50-conversion threshold is met) before day 7 numbers mean anything. Judging a Meta ad set on day 3 performance is judging an algorithm that hasn’t finished calibrating.
Kill a campaign when cost per acquisition exceeds your break-even threshold for two consecutive full measurement cycles, not two days. Pulling the plug mid-learning-phase on Meta, or mid-impression-share-ramp on Google, resets progress and wastes the spend already committed to getting there.
Running Both Platforms Together
There’s no universal budget split that fits every account, and any comparison article that hands you a fixed percentage is guessing. What actually works: start with a 60/40 lean toward whichever platform scored higher in the framework above, run both for a full 60-day cycle, then rebalance based on blended CAC, not on which platform’s own dashboard looks better.
Shared first-party data closes some of the targeting gap between the two. Google’s Customer Match and Meta’s Custom Audiences both accept the same uploaded customer list, letting a business retarget or build lookalikes from identical source data on both platforms rather than treating them as separate audiences built from scratch.
Conclusion
Google Ads and Facebook Ads solve different problems, and the “vs” in every search for this topic hides that fact. Score your offer against intent, audience definability, creative capacity, budget, and sales cycle length, and the right starting platform stops being a guess. Most accounts land on both eventually. The framework above just determines which one goes first, and how much room the second one gets once it’s running.